The P&L says revenue is up nine percent over last year. It also says net margin is down two points, and nobody in the Monday leadership meeting can say exactly why. Ops points at wages. Sales points at the season. The honest answer is usually simpler and harder: the company got bigger without anyone deciding what it should get better at.
The Honest Answer
The company got bigger without anyone deciding what it should get better at.
For established cleaning companies, that’s the real revenue-versus-profit question. Not which number matters — you know both matter — but which one governs decisions when they conflict. At scale, revenue can’t be the governing number, because revenue is the number that looks healthiest while the fundamentals underneath it decay.
How Growth Hides Decay
Revenue is the easiest number in the building to celebrate. It signals momentum externally, settles nerves internally, and answers “how’s business?” in one word. At scale, it can also hide four kinds of slippage at once: labor efficiency drifts as teams expand faster than productivity standards do; pricing softens when volume becomes the goal; schedule density decays when new work gets absorbed wherever it lands instead of routed where it’s cheap to serve; and leadership visibility thins as the layers between you and the work multiply.
None of those show up in the top line. All of them show up in margin — usually a quarter or two later, as a number nobody can explain in the Monday meeting.
What Fixing It Actually Looks Like
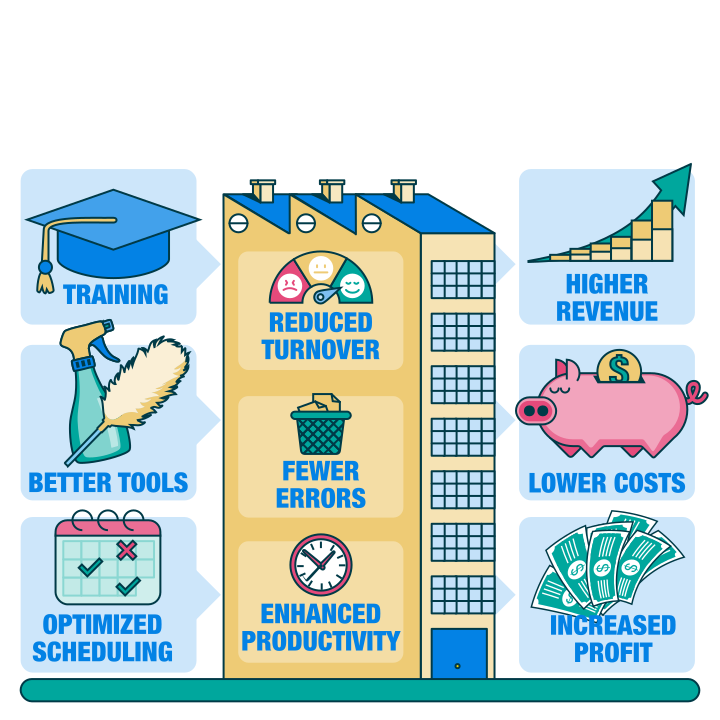
NaturalCare Cleaning Service in Houston — Chad and Diana Henley — moved pricing, scheduling, and labor together instead of treating them as three departments’ separate problems. The results: hourly bill rates up 25%, revenue up 37%, technician pay raised from $15 to around $20 an hour — and labor cost down from 50% of revenue to 40%.
“…our cost of labor has dropped from 50% to 40%. And what that means for us basically puts another $100,000 in profit back into our business every year.”
— Chad Henley, NaturalCare Cleaning Service
Read the sequence again, because it’s the whole argument in one company: they paid their technicians more — a third more — and kept more. That combination doesn’t happen when you’re managing to revenue. It’s the expected outcome when you’re managing the relationship between price, schedule, and productive hours.
The Numbers That Govern
Direct payroll to revenue — and its variance, not just its average. Across MaidCentral’s customer base, this ratio has held at roughly 41–42% in recent months (May 2026: 41.74% on average, and notably consistent across small, medium, and large companies). That’s a reference point from real operating businesses, not an industry standard. At your scale, though, the average is the less interesting number: a company-wide 42% can hide one team running 38 and another running 48. The leak lives in the spread.
Revenue per job hour. A company managing to revenue fills the schedule at whatever rate fills it. A company managing to profit tracks what an hour of delivered work actually brings in — by team — and raises rates on the accounts that drag it.
Drive time as payroll. A full calendar can conceal hundreds of paid windshield hours a month. At multi-crew scale this is often the largest invisible line item on the P&L.
Customer mix. Accounts that generate complaints, rework, and scheduling churn cost margin even while they add revenue. Lifetime value and fit beat bookings volume — and someone has to be measuring both for that to be true in practice.
Curious Where Your Own Numbers Land?
The 41–42% range above is a real reference point — seeing where your teams sit against it takes one working session with your actual payroll data, not a company-wide average.
Where the Governing Number Shows Up
Not in strategy documents — in small decisions. Whether the marginal commercial account at a soft rate gets signed because the quarter needs it. Whether the fourth office hire happens before or after anyone measures what the third one changed. Whether a full pipeline is treated as proof things are working, or as the thing most likely to be hiding what isn’t. When profit governs, pricing discipline stops being negotiable, labor is planned against productivity rather than headcount, and drive time gets treated as what it is: payroll spent producing nothing.
Profit Is Also the Exit Number
Whenever it’s time to sell, transfer, or bring in a partner, buyers price profit quality — its consistency, its transferability, whether it depends on the owner personally holding the walls up. Two companies with identical revenue can be worth wildly different amounts. The one built on governed margins is worth more, and it’s also simply easier to own in the meantime.
What Changes at the Monday Meeting
The version of this company that works isn’t the one that grew slower. It’s the one where the margin question has an answer on Monday morning: which teams earned their hours last week, which accounts are next for a rate correction and what it’s worth, what the new branch’s payroll ratio did in its first month — while there’s still time in the quarter to act.
MaidCentral was built for exactly this kind of operation: scheduling, timekeeping, and job-level economics in one system purpose-built for recurring, labor-driven service work — with role-based access so each manager owns their own numbers without you standing over them. Visibility without micromanagement. Growth becomes a decision you make with numbers in front of you, not a wave you ride and explain later.
Questions Operators at Scale Ask
How do we find margin leaks across multiple crews or locations?
Stop looking at company-wide averages and compare the same ratios — payroll to revenue, revenue per job hour, drive time per crew — across teams. The leak is almost never “everywhere”; it’s concentrated in the spread between your best-run team and your worst. The usual suspects: windshield time, legacy pricing, and rework.
Our payroll ratio looks fine company-wide — why is margin still slipping?
Two reasons, usually. Averages mask offsetting problems — one team’s discipline subsidizing another’s drift. And payroll isn’t the only leak: drive time, supplies creep, rework, and growth booked at soft rates all bleed margin without moving the payroll line.
Does revenue growth actually increase the value of a cleaning business?
Only when margin holds while it happens. Buyers price profit quality and transferability, not top-line size. Revenue growth with decaying margins can make a company less sellable — bigger, heavier, and harder to run without its owner.
How did a cleaning company cut labor cost from 50% to 40% of revenue?
NaturalCare Cleaning Service (Houston) raised bill rates 25%, grew revenue 37%, and raised technician pay from $15 to ~$20/hour — by moving price, schedule, and productivity as one system instead of three separate problems. Chad Henley’s summary: it “puts another $100,000 in profit back into our business every year.”
Earlier in the journey — under $1M, still adding crews? The same problem has a different shape at your stage. We wrote that version separately →
Want to see where you sit first? Run direct payroll to revenue for last quarter — per team, not just company-wide — and set it against the monthly Professional Cleaning Index.
Ready to Look at Your Actual Numbers?
Bring your P&L to a demo — not a feature tour, a working session on where your margin is going.